Market Euphoria
US equity market valuations have experienced remarkable market cap appreciation and resilience to downdrafts. The headline news attributes it to technological innovation, low interest rates, and fiscal stimulus. Is it real, or are we experiencing a tech bubble that has, by some metrics, surpassed what we saw in the dot com bubble of the late 90’s? Key valuation metrics suggest that US stocks, particularly in technology-heavy indices, are trading at extended levels. Will Artificial Intelligence (AI) deliver, or are we repeating our past mistakes of over-estimating the immediate benefits of a ground-breaking technology and getting ahead of ourselves?
Concentration in the S&P 500: Dominance of NVDA and MSFT
The S&P 500 is market-cap weighted, meaning larger companies exert outsized influence in the S&P 500’s returns. As of August 14, 2025, the S&P 500’s total market capitalization is approximately $54.45 trillion. About a year ago, I showed that the “Magnificent 7” made up 30.88% of the S&P 500. Today, the top 7 names make up 35.2% of the S&P 500! Broadcom replaced Tesla in the top 7, but the others kept their spot.
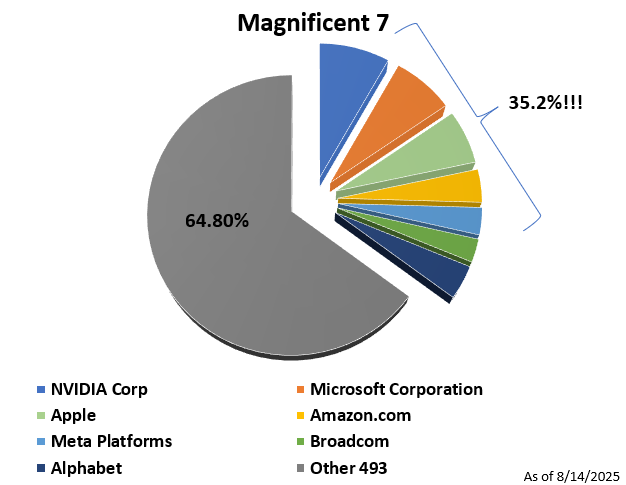
Figure 1-Top 7 at 35.2%, Top 10 at 40%, Top 2 at 15.4%!
The big change is that Apple has lost its number one spot since NVIDIA and Microsoft had stellar growth in their valuations.
- NVIDIA: With a market cap of $4.45 trillion, NVIDIA represents about 8.17% of the S&P 500, driven by its role in AI chip production.
- Microsoft: With a $3.91 trillion market cap, Microsoft comprises roughly 7.19% of the index, fueled by cloud computing and AI integrations.
Together, these two stocks make up over 15% of the S&P 500, highlighting the tech-heavy weighting of market peaks we have seen in the past. The top 10 companies now drive 40% of the index, the highest concentration in history, amplifying volatility risks if AI sentiment shifts and disappoints on growth expectations.
S&P 500 Market Capitalization Breakdown (August 14, 2025)
| Company | Market Cap (Trillions USD) | % of S&P 500 |
| NVIDIA (NVDA) | 4.45 | 8.17% |
| Microsoft (MSFT) | 3.91 | 7.19% |
| Apple (AAPL) | 3.41 | 6.27% |
| Others (Top 10 Total) | 21.8 | 40.02% |
| Full S&P 500 | 54.45 | 100% |
Market Valuation Metrics
P/E:
The Nasdaq Composite, heavily skewed towards technology, gives us a more granular view of tech valuations. During the dot-com bubble, the Nasdaq’s price-to-earnings (P/E) ratio peaked at 200 in March 2000, before declining by over 75%. The Nasdaq’s weighted average P/E ratio is about 36.5, but not yet at 2000 era bubble extremes. The top 3 names make up more than 26% of the Nasdaq 100, so a disappointment from those three names in AI’s delivery to the bottom line could create a nasty tailwind. NVDA sits at a P/E of 58.7, MSFT at 38.3, AAPL at 35.3. Unlike the cash burning Tech Bubble of the dot com era, these companies are behemoths that generate solid earnings, but can they deliver on growth expectations?
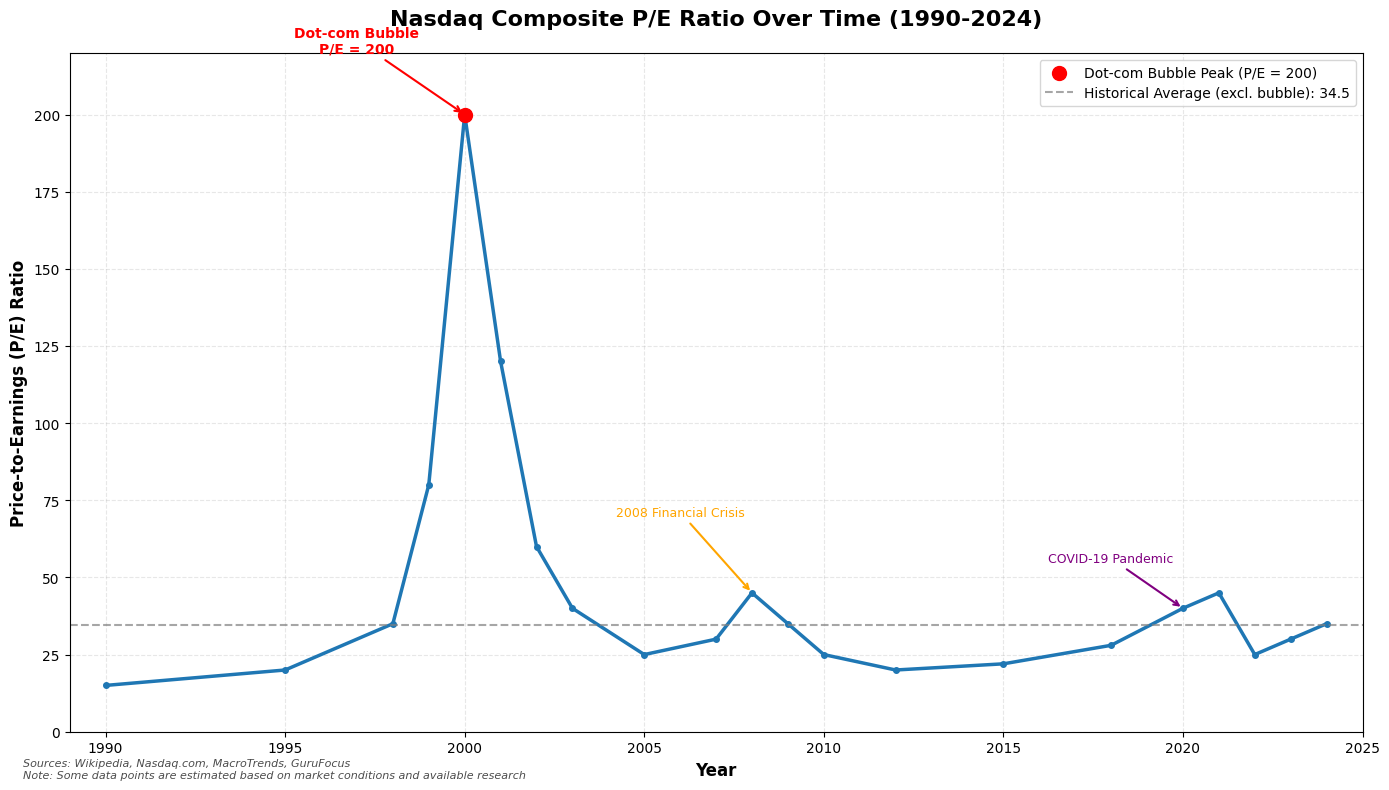
Figure 2 – Elevated P/E on the Nasdaq, but not the 90’s Tech Bubble
Market Cap/Money Supply:
The Nasdaq’s aggregate market capitalization relative to the US M2 money supply gauges liquidity-driven overvaluation. The Nasdaq’s current market cap is $30.95 trillion, while M2 is $22.02 trillion, yielding a ratio of 140%. This ratio is in nosebleed territory similar, but higher, than what we saw during the dot com bubble. This liquidity allows for stock prices to be detached from fundamentals, which makes them vulnerable to any Fed tightening:
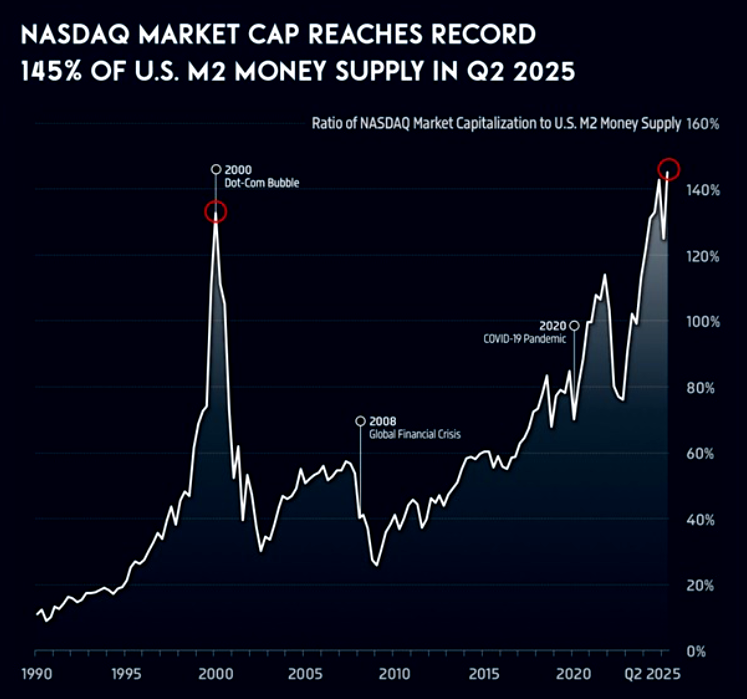
Figure 3 – Is liquidity driving valuations?
The Buffett Indicator, the ratio of total US stock market capitalization (Wilshire 5000) to US GDP, stands at ~210%. This is the highest reading ever:
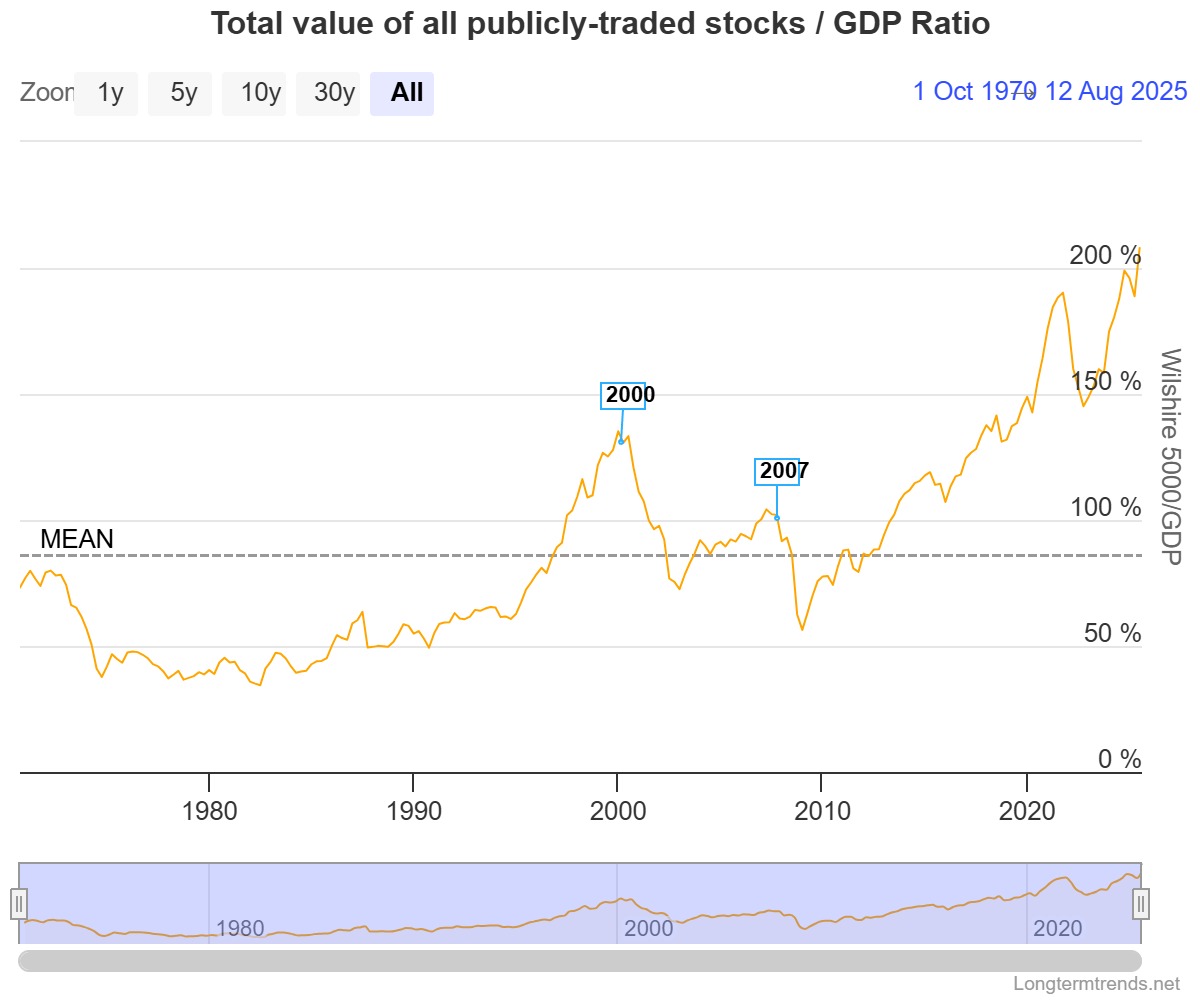
Figure 4 – The Buffett Indicator is pointing towards excess…
Might be a strong reason why Warren is sitting on a record level of cash:
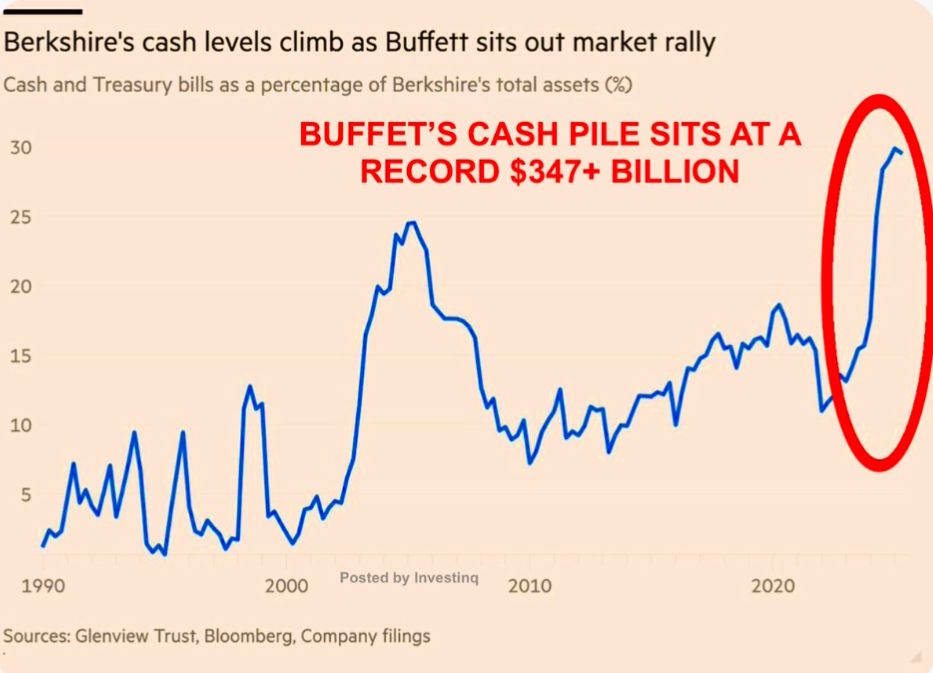
Figure 5 – Buffett raised a record level of cash
Inflation Risks and Stagflation Potential
Recent US tariffs have not yet caused a sharp inflation spike, as importers absorbed costs or have delayed pass-throughs. Tariffs generated $28 billion in July 2025, tripling 2024 levels, without immediate and broad inflationary pressure. Most analysts are projecting a 1 – 1.5% inflation increase by year-end, which could push core CPI closer to 4% as tariffs impact consumer goods prices.
A stagflationary environment—persistent inflation amid slowing growth—could emerge if the Federal Reserve lowers rates to support a weakening economy. Rate cuts may provide the monetary easing that lets the music continue to play for equity markets. Further fiscal stimulus, expanding the money supply, could reignite inflation which would erode real returns. Stimulus and inflation would make stocks a better long-term preservation of wealth than long-term bonds at ~5% yields. Historical precedents like the 1970s highlight the need for inflation-protected assets.
Conclusion
While US stocks offer AI and innovation driven upside, it seems very prudent to take a measured and hedged approach to equity upside. Implied volatility is relatively cheap and it might be a better opportunity to utilize options to reduce downside risk. Persistent inflation and an economy that skirts around a recession can let the nominal prices continue to climb. Calling a bottom when stocks are cheap is much easier than calling a market top.
“The market can remain irrational longer than you can remain solvent”
-John Maynard Keynes
Comments are closed