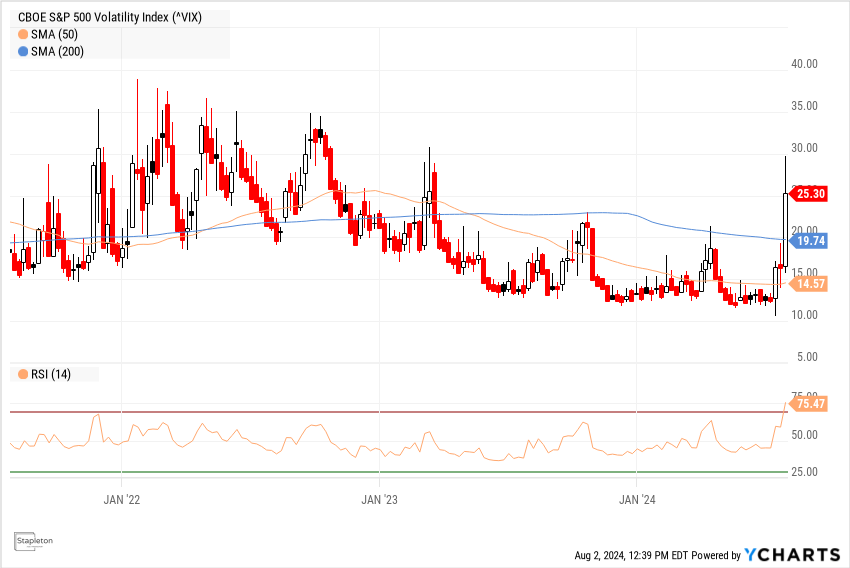
As I am writing this Friday note, the S&P 500 is down 2.35%, Nasdaq down 2.8% and the 10 year US Treasury is down 16.3bps to 3.81%. Most importantly, the VIX hit 29.66 this morning which is the highest level that we have seen since March 2023:
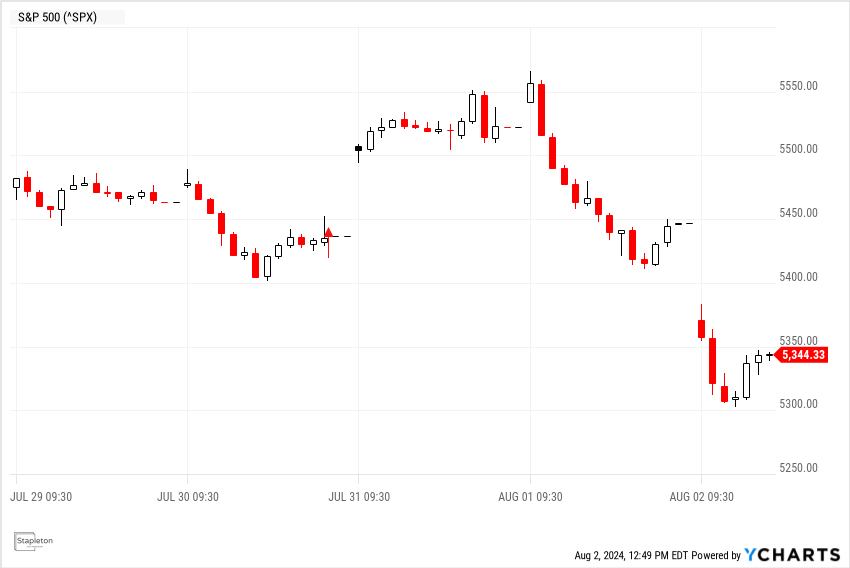
With the Fed’s comments on Wednesday and commitment to a rate cut in September, we saw a +2.4% pop in the S&P 500. Given some bad economic numbers, we have given up more than that with about a 4% decline:
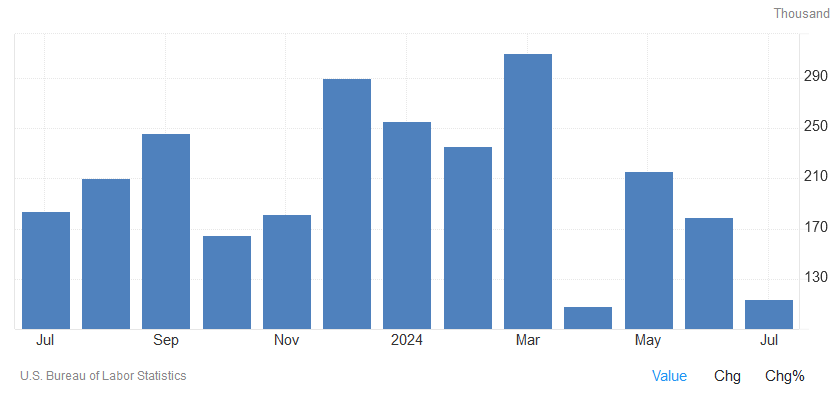
You might ask what has changed? The concern is that the Fed is behind the economy and should have already cut rates to prop up the markets and the underlying economy. This time around, bad news is bad news because the rate cuts were already baked into the market but now the market questions if they are too late. The +114k payroll announced this morning was a huge miss versus the expected 175k. In addition, the June reading was revised to 179k from a previous 206k:
A few other items to note about today’s employment report:
- Number of people employed part-time for economic reasons increased by 346,000 to 4.6 million
- Number of people non in the labor force who want a job increased by 366,000 to 5.6 million
- Monthly increase in hourly earnings rose by .2% versus .3% expected which equates to 3.6% growth YoY vs expected 3.8%
- Average work week went down by .2 hours to 39.9 hours
- The unemployment rate increased by .6% since last year’s lows which trigger’s Claudia Sahm’s recession rule (if 3-month unemployment rate moving average rises by .5% from its low in the past year)
With the negative surprises, some banks are suggesting that a 50bps rate cut in September is not off the table. Some are suggesting that the Fed will continue to cut through mid-2025 until a target band is reached of 3 – 3.25%.
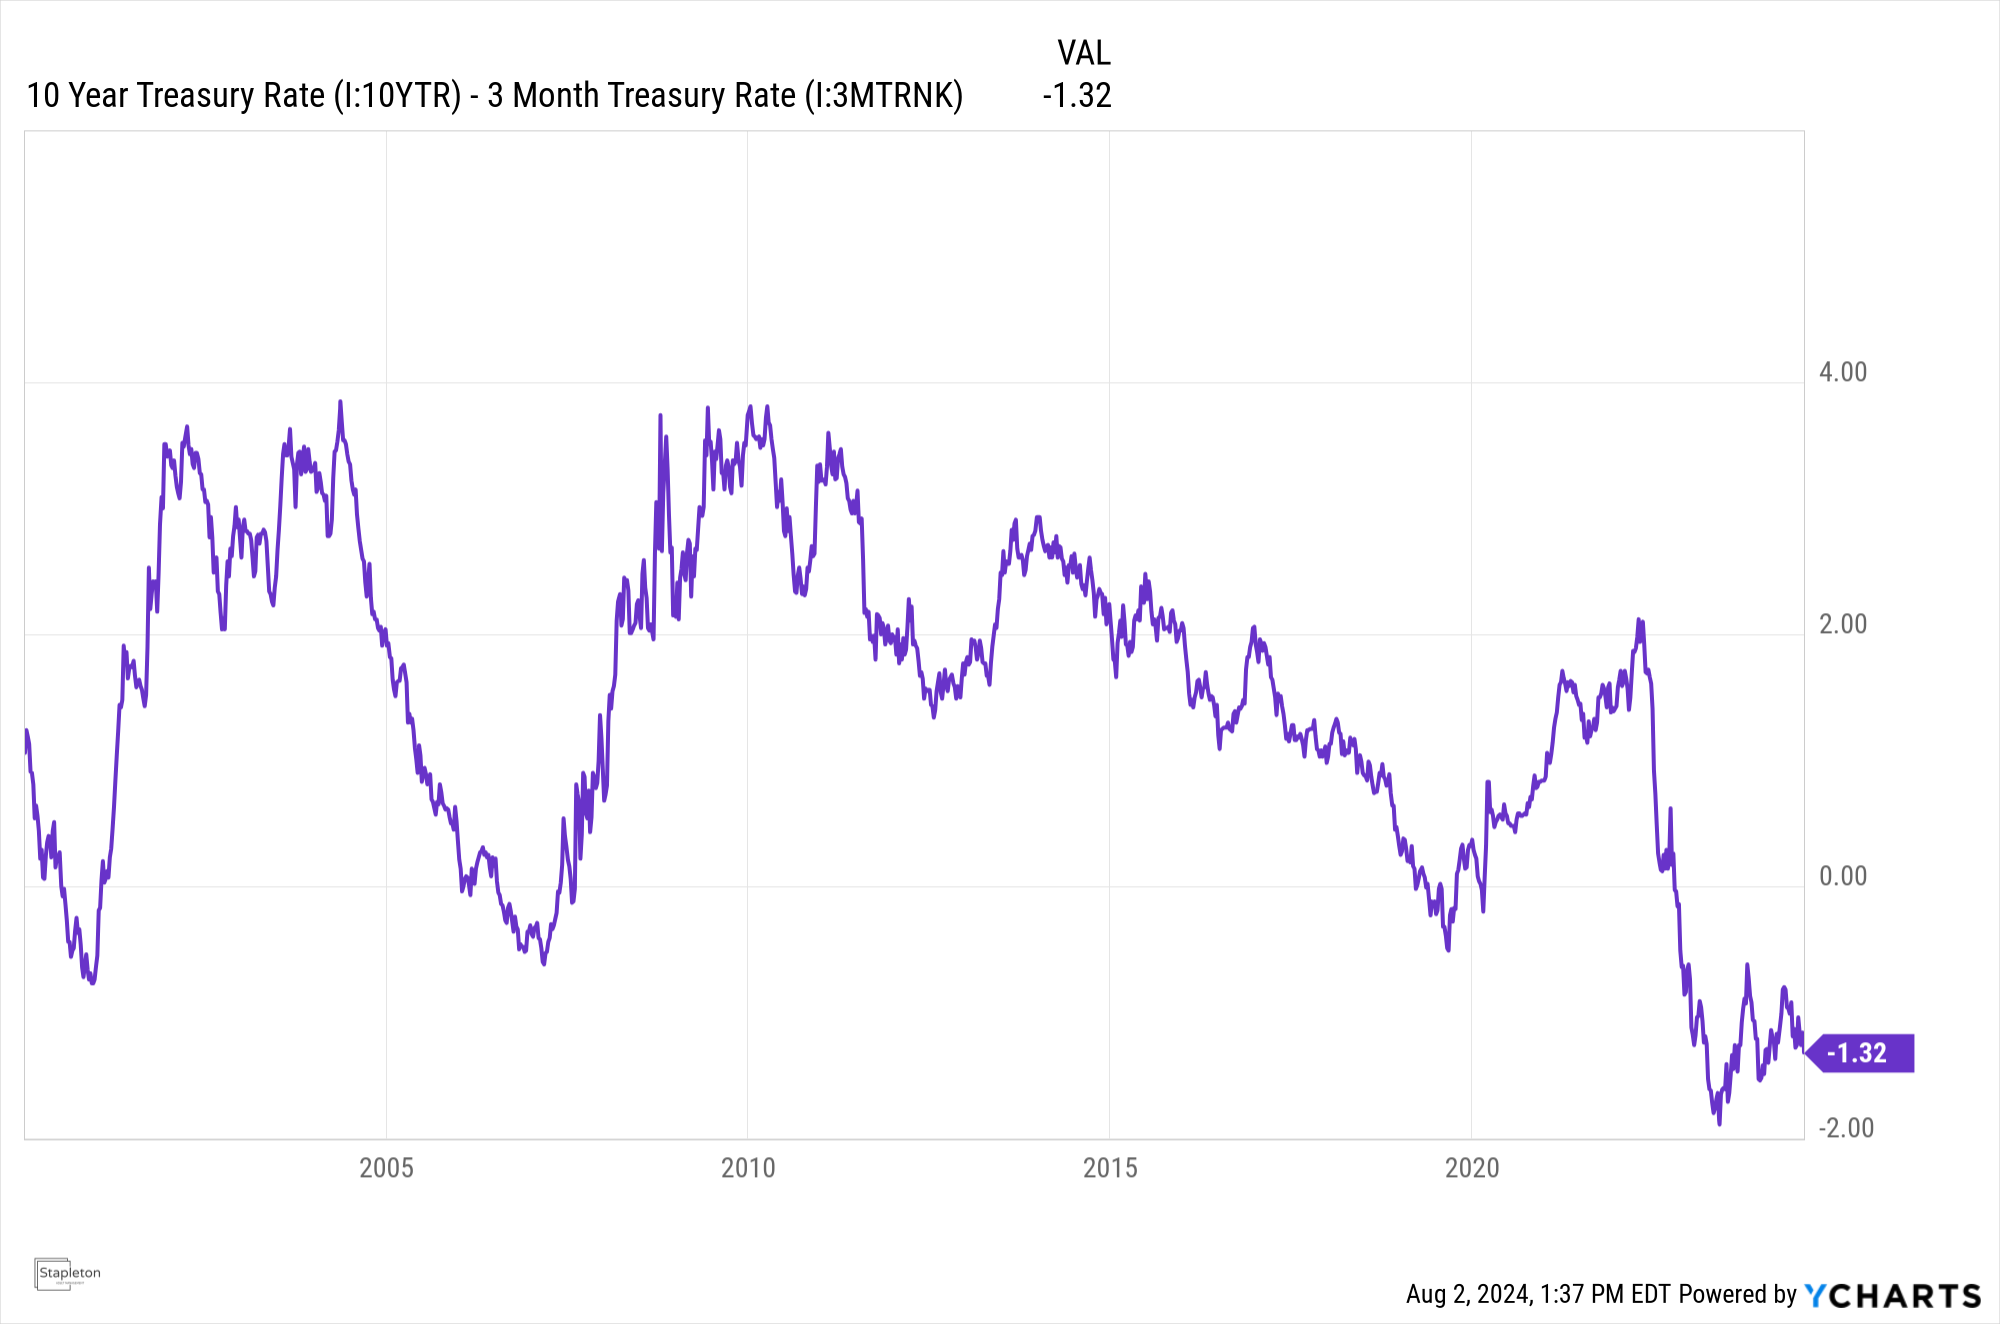
The jobs data only adds more concerns about a recession. The yield curve has been inverted since October 2022:
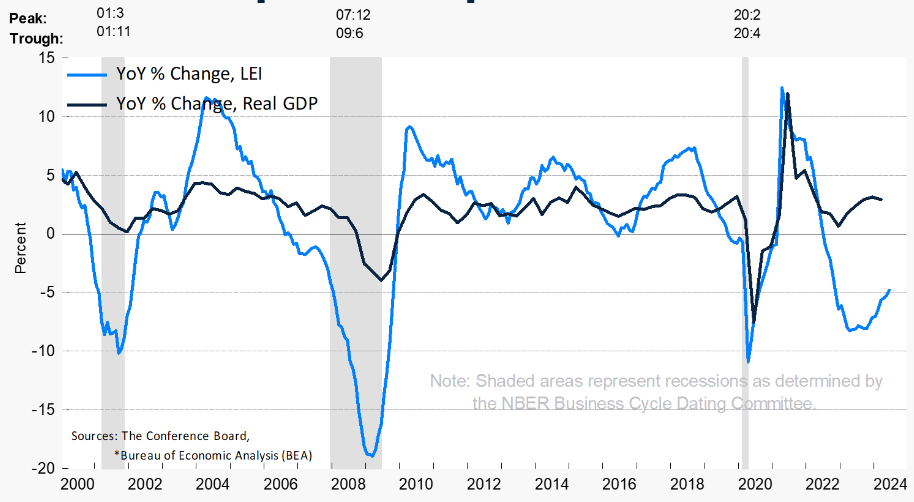
The Leading Economic Indicator Index (LEI)[i] has been negative for nearly the same period:
One last point that I want to make is that the US Consumer is stretched. Yes, inflation has come down from its high of 8.58% YoY in 2022, but it is still clicking in at 2.97% YoY and average wages have not increased enough to offset higher prices. As a way to deal with this, US consumers have taken on more debt than ever with total household debt at 17.69 Trillion and credit card debt north of 1.1 Trillion:

A cut in interest rates will lower the cost of carrying floating debt (including credit cards) but it might re-ignite an inflationary (stagflationary?) environment. This is why I will continue to say that central banks are caught between a rock and a hard place.
With Japan’s massive Debt-to-GDP ratio of 260%, I have always considered to think of Japan as the canary in the coal mine. The Japanese Yen declined by over 40% since 2022 and you do not read that much about it in the main market news outlets. More recently the Bank of Japan has been increasing interest rates to defend its currency. Today the Nikkei index is down ~6%. The Bank of Japan knows exactly what it means to be caught between a rock and a hard place…
[i] The U.S. Leading Economic Index (LEI) is a composite index designed to predict future economic activity. It is composed of ten economic indicators that collectively provide a forward-looking perspective on the overall economy. The components of the LEI are:
-
Average Weekly Hours, Manufacturing: Measures the average number of hours worked per week by production workers in the manufacturing sector.
-
Average Weekly Initial Claims for Unemployment Insurance: Tracks the number of new claims for unemployment benefits filed each week.
-
Manufacturers' New Orders for Consumer Goods and Materials: Indicates future production activity based on new orders for consumer goods.
-
ISM® Index of New Orders: Part of the Institute for Supply Management's manufacturing survey, focusing on new orders.
-
Manufacturers' New Orders for Nondefense Capital Goods Excluding Aircraft: Reflects business investment in equipment and machinery.
-
Building Permits for New Private Housing Units: Represents future construction activity based on permits issued for new housing units.
-
Stock Prices (S&P 500): Measures stock market performance, reflecting investor confidence.
-
Leading Credit Index™: An index that includes various financial indicators such as interest rates and credit spreads.
-
Interest Rate Spread (10-year Treasury bonds less Federal Funds rate): Measures the difference between long-term and short-term interest rates.
-
Average Consumer Expectations for Business Conditions: Based on consumer sentiment surveys, reflecting expectations for the economy's future.
Comments are closed