

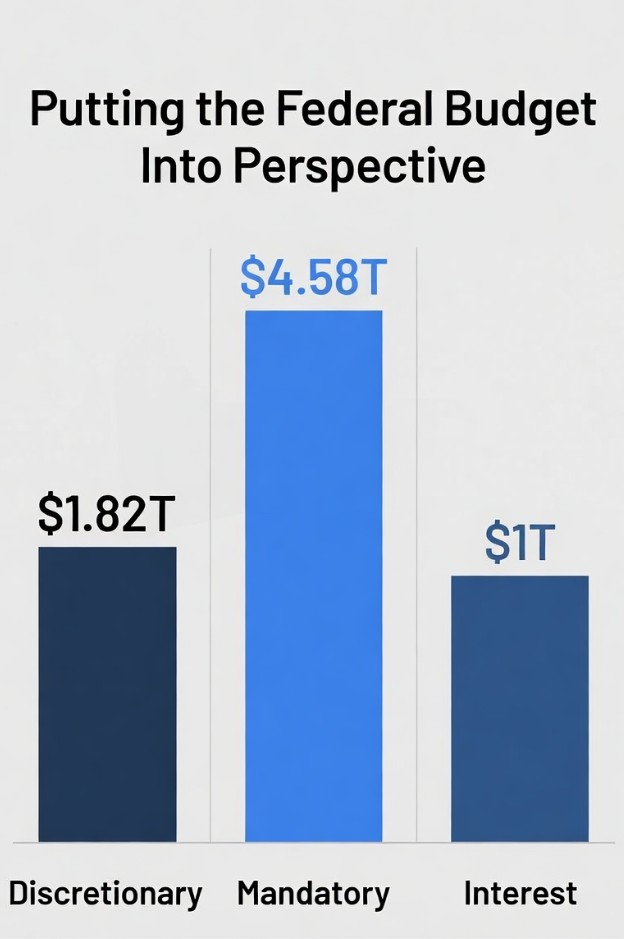
Every fall, the loudest fight in Washington is over discretionary spending. It is the part of the federal budget that dominates the news headlines: the defense bill, the shutdown threats, and the appropriations fights. In the past two years, we lived through the longest government shutdown in modern history, followed shortly by a second, shorter one. Discretionary spending gets all the attention.
Discretionary spending is also the smallest, and the slowest-growing, piece of the federal budget.
Understanding why requires separating the budget into the three buckets that actually determine where the money goes. Once you see the shape of that trend and the breakout of where the growth comes from, the headline fights over discretionary spending start to look like the wrong argument entirely.
We keep putting the wrong em-PHA-sis on the wrong syl-LA-ble
The Three Buckets
Discretionary spending is the portion Congress votes on every year through the appropriations process. It funds the military, national parks, federal law enforcement, and most of what people picture when they think of “the government.” Because it requires an annual vote, it is the only piece of the budget that gets negotiated, delayed, or shut down. It is also the only piece Congress can meaningfully change from one year to the next without rewriting existing law.
Mandatory spending happens automatically because of laws already on the books. Social Security, Medicare, and Medicaid are the whales. If someone qualifies for the program, the payment goes out, whether or not Congress passes a budget that year. Changing this bucket requires changing the underlying law, not just the annual appropriations bill.
Net interest is what the government pays to service the national debt. It is not a program, and it is not a policy choice in any given year. It is simply the bill that comes due on money already borrowed, and it is the one bucket that nobody in Washington directly controls in the short term.
A Decade in Three Buckets
| Fiscal Year | Discretionary | Mandatory | Net Interest | Total Outlays |
| 2016 | $1.18T (31%) | $2.43T (63%) | $0.24T (6%) | $3.85T |
| 2019 | $1.34T (30%) | $2.73T (62%) | $0.38T (8%) | $4.45T |
| 2023 | $1.70T (28%) | $3.78T (62%) | $0.66T (11%) | $6.13T |
| 2026 (est.) | $1.82T (25%) | $4.58T (62%) | $1.00T (14%) | $7.40T |
Figures may not sum to 100% due to rounding.
Over this decade, discretionary spending grew from $1.18 trillion to an estimated $1.82 trillion, an increase of roughly 54%, in the same neighborhood as cumulative inflation over the period. As a share of the total spending budget, discretionary spending actually shrank, from 31% of federal spending in 2016 to about 25% today.
Mandatory spending nearly doubled in dollar terms, from $2.43 trillion to an estimated $4.58 trillion, and has held steady at roughly 62% of the total during this entire decade.
The real story is interest expense. Net interest payments went from $241 billion in 2016 to an estimated $1.0 trillion in 2026, more than a fourfold increase in a decade. Interest’s share of the federal budget grew from 6% to 14% over that same window. Put another way: the federal government is now on pace to spend more on interest than it spends on the entire discretionary defense budget.
Why Interest Grew So Much Faster Than Everything Else
Two forces are compounding.
The first is simply more debt. The federal government has run a deficit every year over this period, and every dollar of deficit adds to the total amount owed. More debt outstanding means more interest owed.
The second gets less attention: the interest rate the government pays on that debt. The average interest rate on all marketable Treasury securities was about 2% in 2014, but today it sets around 3.4%. That may not sound like a huge increase, until it is applied to roughly $30 trillion in outstanding debt. As a rule of thumb, every 1 percentage point increase in the average rate paid across the entire federal debt adds about $300 billion a year in interest costs.
The Refinancing Wall
This is the part of the problem that has nothing to do with next year’s budget fight, and everything to do with debt that already exists.
Treasury debt carries an average maturity of about 6 years. That means the government is constantly replacing old debt with new debt as the old debt comes due, a process known as refinancing, or rolling over. According to the Treasury Department’s own figures, roughly one third of all outstanding federal debt matures within any given 12 month period. Within 5 years, more than two thirds of the entire debt stock will have matured and been reissued at whatever interest rate happens to prevail at the time.
None of this is optional, and none of it depends on what Congress decides to fund next year. Debt that was issued years ago at 1% or 2% is coming due on a fixed schedule, and it has to be replaced with new debt priced at today’s rates, whatever those turn out to be.
So the more important question is not whether the government will spend more. It is what rate that maturing debt gets refinanced at. Using the current stock of roughly $30 trillion in marketable debt and Treasury’s own maturity schedule, here is the additional annual interest cost, above what is being paid today, under four different average refinancing rate scenarios:
| Year | 4% Scenario | 5% Scenario | 6% Scenario | 7% Scenario |
| 1 | $59B | $158B | $257B | $356B |
| 2 | $86B | $230B | $374B | $518B |
| 3 | $104B | $278B | $452B | $626B |
| 4 | $115B | $307B | $499B | $691B |
| 5 | $122B | $326B | $530B | $734B |
| 5-Yr Total | $488B | $1.30T | $2.11T | $2.93T |
Scenarios measure the added cost above today’s 3.4% average rate on existing marketable debt. New borrowing to cover future deficits is not included and would add further cost.
By year 5, a sustained 6% average refinancing rate adds more than half a trillion dollars a year in interest costs, on top of what is already being paid. At 7%, that figure climbs to nearly $735 billion a year. Add up all 5 years and the cumulative extra cost ranges from about $490 billion at the low end to nearly $2.9 trillion per year at the higher end, and that is before accounting for any new borrowing to cover future deficits, which would add still more.
The Reality Check
None of this depends on who holds any particular office or which party controls Congress. It is arithmetic. A large stock of debt issued years ago at low rates is working its way through a fixed maturity schedule, and it has to be replaced, on a rolling basis, at whatever rate the market is charging when it comes due.
Discretionary spending, the part of the budget everyone argues about every year, is a shrinking share of the total. Mandatory spending and interest, the parts that run largely on autopilot, are the growing share, and interest has become the fastest moving piece of all.
The mountain in front of us is not a partisan mountain.
If mandatory spending is left to grow unchecked, on its schedule, the effect will not stay confined to a budget document. Every extra dollar the government borrows competes with households and businesses for the same pool of investor capital, and that extra demand will require higher interest rates to compensate for increasing credit and inflation risk. It becomes a reinforcing loop: larger deficits require more new debt on top of the refinancing wall already in front of us, and a market pricing in that risk only raises the rate at which that wall has to be climbed.
Comments are closed