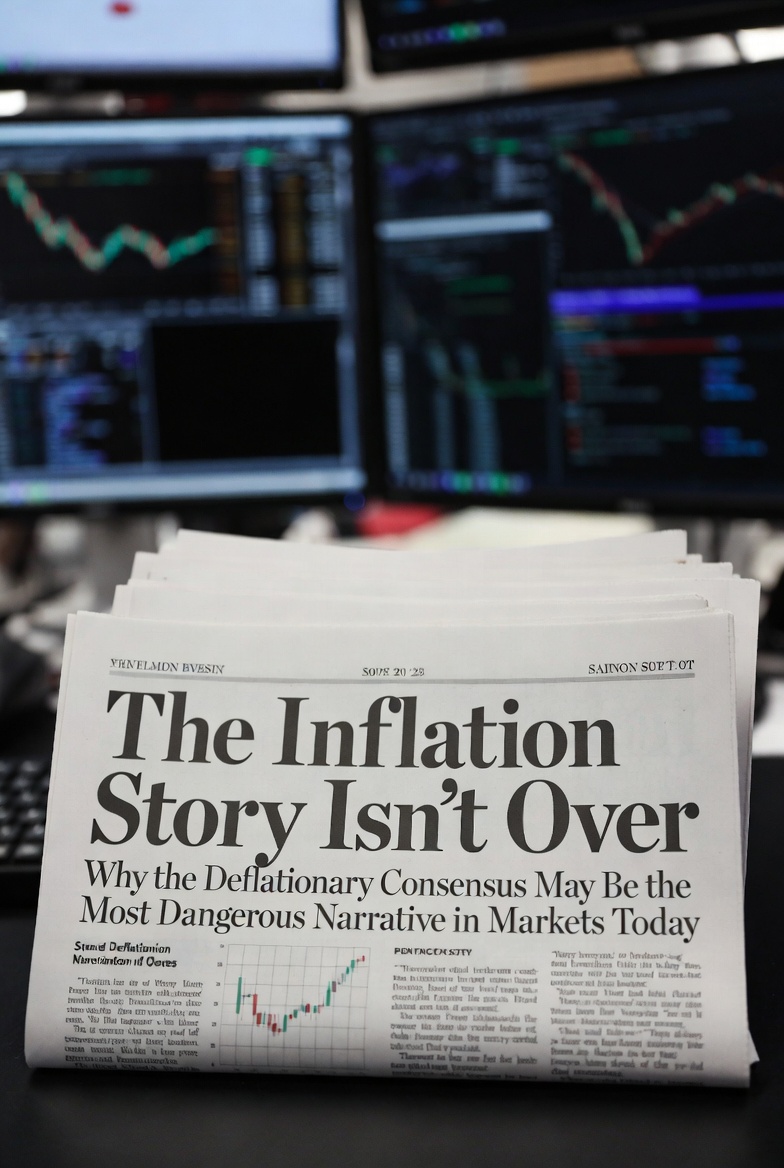
I’ve been getting a lot of questions lately about whether the inflation story is truly behind us. The consensus seems pretty comfortable: the Fed pulled off a soft landing, CPI has come way down from its 2022 peak, new Fed Chair Warsh is a Hawk, and artificial intelligence is going to usher in a new era of deflationary productivity. I understand why people believe this. Some of it is even true. But I think the consensus is dangerously incomplete, and I want to walk through why I believe we may be in the early innings of a second inflationary wave, because the story is not over.
This isn’t a forecast of doom. The 1970’s inflation cycle ended. Volcker fixed it. People who understood what was happening and positioned themselves accordingly came out well ahead. That’s the framework I want to share.
The Problem with How We Measure Inflation
Before I even get to the AI debate or fiscal policy, I want to flag something that bothers me about the entire inflation conversation: the measuring stick itself is compromised.
The BLS uses something called hedonic quality adjustment. When a television gets bigger and cheaper, e.g. you can now buy a higher quality 100-inch TV for less than you paid for a 65-inch TV five years ago, they don’t simply record that as a price decline. They adjust for the “quality improvement” and treat part of that as a real goods improvement rather than deflation. Same with computers, smartphones, cars. The practical effect is that CPI systematically captures deflation in discretionary technology goods while understating the inflation that people actually feel in the categories that matter most for survival.
There is also what economists call substitution bias: when steak gets too expensive, the CPI assumes you buy chicken. When chicken gets too expensive, you buy eggs. The basket adjusts down with your purchasing power. From a pure cost-of-living perspective, maybe that’s defensible. But from a standard-of-living perspective, you’re measuring the cost of managed decline, not the cost of holding your living standard constant.
I keep a Zimbabwe trillion-dollar note above my desk as a constant reminder that currency debasement has a history and that the measuring tools governments use to report inflation rarely align with how you feel. That feeling is closer to reality.
The AI Deflation Thesis: Right, But Only in the Wrong Places
I want to be fair to the AI deflation argument, because it isn’t wrong, it’s just narrower than people think.
AI is genuinely and powerfully deflationary in what I’d call the screen world: software, legal research, financial analysis, customer service, medical diagnostics, content creation etc. Anywhere that the underlying work is fundamentally information processing, pattern recognition, or digital production, the marginal cost of intelligence is approaching zero. That is a truly deflationary force.
The problem is that the screen world is not where inflation is eating the family’s budget. Think about what actually consumes a household’s budget:
- Healthcare is 18% of US GDP and is structurally protected from AI cost compression by a network of hospital consolidation, pharmaceutical patent structures, insurance company incentives, and Pharmacy Benefit Management (PBM) opacity. Meaningful structural cost reduction in healthcare is a 15–25 year project at best. The Trump administration is only clipping at the edges. The whole industry needs overhauled.
- Housing and land cannot be produced by AI. No amount of computing power creates more desirable land. General-purpose construction robotics for unstructured outdoor environments: grading, framing, pouring foundations. Optimus is not going to build your house in the next 5 years.
- Energy: the transition to renewables is itself capital and resource intensive, competing for copper, lithium, cobalt, and steel. The end state may be deflationary. The path there is not. We will be building traditional power plants and nuclear plants. Neither will come close to covering the demand.
- Food production at mass scale remains largely beyond current robotics capability. Industrial-scale agricultural automation will help eventually, but not on a timeline that matters for the next decade.
The honest summary: AI is deflationary for the things people want, not the things that people need.
There’s also a second-order dynamic that the AI deflation crowd rarely addresses. When AI displaces white-collar service workers at scale, the political response will almost certainly involve expanded transfer payments of some kind. Enhanced earned income credits, sector-specific support programs, or eventually something resembling universal basic income. Those programs will mostly be funded by monetary expansion (aka inflation).
The Fiscal Reality That Doesn’t Care About Narratives
I’ve written about fiscal dominance in prior pieces, but I want to revisit the core math because I think it’s the most important thing to understand about the structural inflation environment we are in.
The US federal government is currently spending more on debt interest than on national defense. Annual interest expense has crossed $1 trillion. Federal debt-to-GDP has crossed 120%. The CBO’s own projections under current policy show debt-to-GDP reaching 150%+ by 2050, and that’s the optimistic scenario, assuming no recessions, no new military engagements, and no new entitlement expansions.
The mandatory spending problem is the structural core. Social Security and Medicare together represent approximately $50 trillion in unfunded liabilities over a 75-year projection horizon. I have zero confidence that Congress will address this proactively. The political economy is simple: any meaningful benefit reduction affects the most reliably voting demographic in the American electorate. Politicians don’t do that voluntarily. They do it when the market forces it.
In 1981, when Volcker broke the inflation cycle with a 20% fed funds rates, federal debt was approximately 30% of GDP. Today it is 120%. Every 100 basis points of rate increase adds roughly $250–300 billion annually to federal interest expense as debt rolls over. At some point, tighter monetary policy becomes self-defeating; it worsens the fiscal picture, which undermines confidence in the dollar, which puts upward pressure on inflation expectations. That’s the fiscal dominance trap. Volcker didn’t face it at that scale. Now we have to.
I’ve heard the Japan counterargument: Japan has run debt-to-GDP above 200% for decades without a hyperinflationary spiral. That is true, but Japan’s demographics are uniquely deflationary, its household saving rate is structurally different, and its government debt is almost entirely domestically held. The US has better demographics and reserve currency status, but reserve currency status is not a birthright, it is a function of institutional credibility that is itself a function of fiscal discipline. That’s a circular dependency.
What Gold Tells Us About Inflation Regimes
Before I get to where I think we are in the current cycle, it’s worth looking at what happened to gold during the 1970s inflation episode — because the scale of the move is easy to understate in hindsight.
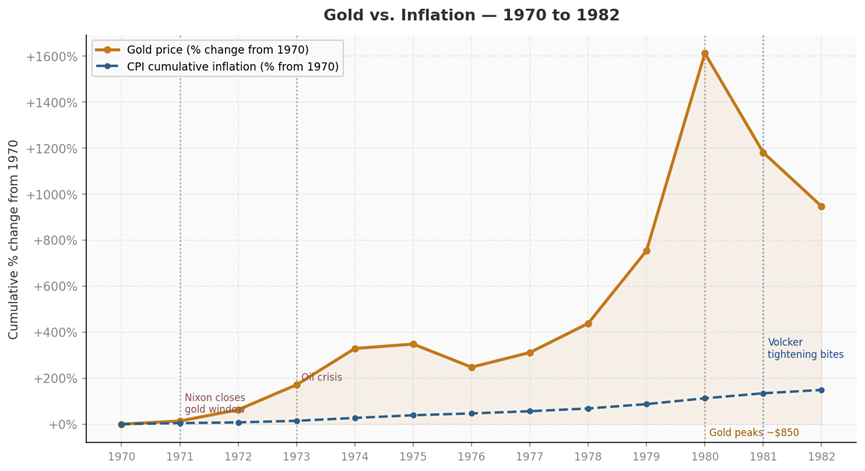
Figure 1 – Gold’s cumulative percentage gain versus CPI inflation from 1970 to 1982. Gold peaked near 2,300% cumulative gain in January 1980 while CPI rose roughly 120% over the same period.
From 1970 to the January 1980 peak at roughly $850/oz, gold gained approximately 2,300% cumulatively. CPI over the same period rose about 120%. Gold didn’t merely keep pace with inflation, it dramatically outpaced it, delivering significant real purchasing power gains over the decade.
But notice the 1975–76 correction, a 30%+ drawdown mid-cycle before gold resumed and ultimately tripled again into the 1980 peak. The lesson I take from that: holding hard assets through an inflationary regime requires accepting that the cycle rarely runs in a straight line. There will be periods when it looks like the inflation story is over. It usually isn’t.
Also worth noting: the 30-year Treasury bond peaked at 15.21% in October 1981 — a full 21 months after gold peaked. Gold sniffed out the inflation regime change first.
Where Are We in the Cycle? The 1970s Comparison
This is the part I find most compelling and most underappreciated in the current conversation. When we look at the structure of the 1970s inflation cycle versus the post-Covid cycle, the alignment is striking.
The 1970s inflation did not consist of a single wave. It had two. A first wave peaked at 12.3% in late 1974. Inflation then fell to a trough of roughly 4.9% by late 1976. Then a second, higher wave peaked at 14.8% in early 1980, driven by the Iranian Revolution, a second oil shock, and the accumulated credibility deficit of a Fed that had declared victory prematurely.
Now look at the post-Covid cycle alongside it, with the peaks aligned at month zero:
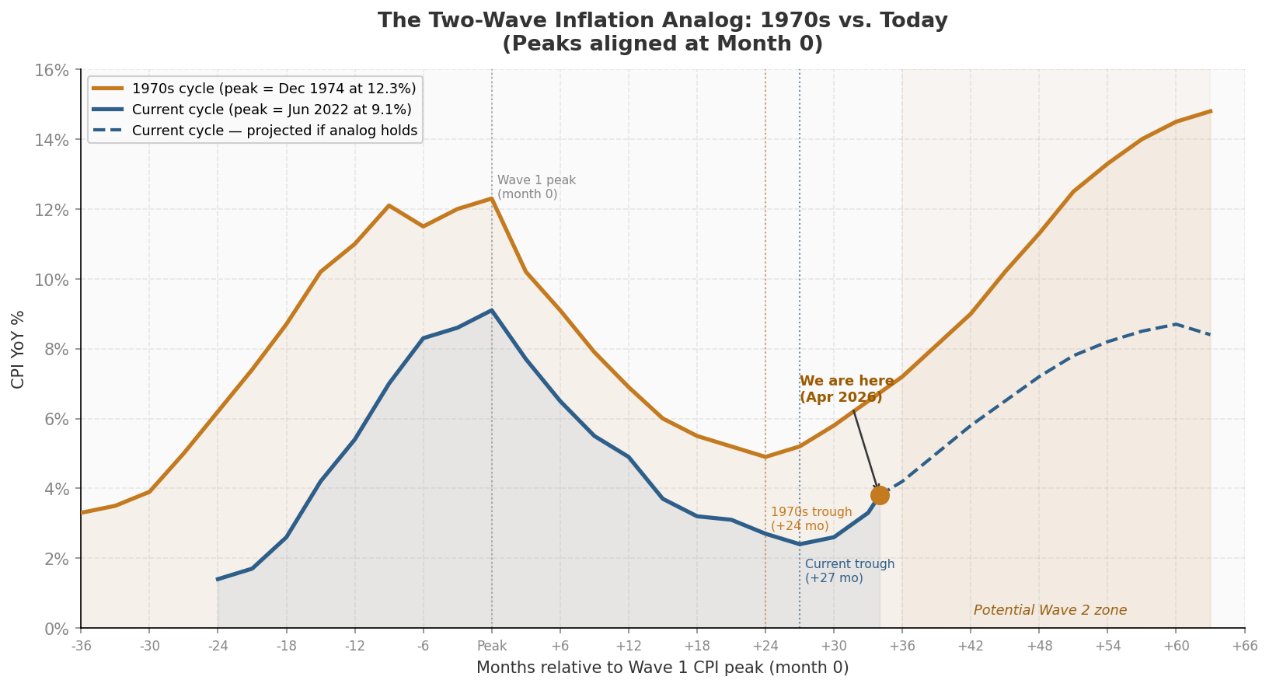
Figure 2 – The 1970s two-wave inflation cycle (gold) versus the post-Covid cycle (blue), peaks aligned at month 0. The dashed blue line shows the projected path if the analog continues to hold. “We are here” marks April 2026 at month +34.
The structural parallel is difficult to dismiss as coincidence. Here’s the data side by side:
| Cycle Marker | 1970s Cycle | Current Cycle |
| Wave 1 peak | 12.3% (Dec 1974) | 9.1% (Jun 2022) |
| Inter-wave trough | 4.9% (Dec 1976, +24 mo) | 2.4% (Sep 2024, +27 mo) |
| Trough vs. peak | ~60% retracement | ~74% retracement |
| Re-acceleration onset | Month +27 | Month +28 (observed) |
| Reading at month +34 | ~5.5% | 3.8% (Apr 2026) |
| Wave 2 peak (1970s) | 14.8% (Mar 1980) | Analog implies 2027–2028 |
As of April 2026, headline CPI has re-accelerated to 3.8%, energy costs are running nearly 18% year-over-year, and shelter inflation is re-accelerating. The analog implies we are in the early innings of a second wave, with the potential peak somewhere in the 2027–2028 window if this comparison holds.
The Caveats
Japan has gone through thirty years of extraordinary deficit spending and debt monetization without runaway inflation. Could the United States be given a runway that is longer than reasoning?
A severe global recession or credit event could produce a temporary deflationary shock that delays the second wave rather than cancelling it. In that scenario, we could experience a year of deflationary pressures before the money printing presses spark the next wave.
What This Means Going Forward
My purpose in writing this isn’t to predict a specific CPI number in a specific quarter. It’s to share the analytical framework that informs my thinking on portfolio construction, and to ensure the people I work with understand the reasoning, not just the conclusion.
The AI deflation thesis is real, but categorically mismatched with where inflation actually eats purchasing power. The fiscal math is essentially locked in the near term: there is no realistic path to surplus without a forcing crisis, and Congress has demonstrated no appetite to get ahead of it. The 1970s comparison: while imperfect, is more structurally consistent with what I’m observing than the “soft landing complete” narrative.
In this environment, I think a few broad principles are worth centering around regardless of specific portfolio construction:
- Real assets over financial promises. Assets with intrinsic value that reprice with inflation are structurally better positioned than long-duration financial promises that reprice against you.
- Short duration discipline. The risk of long bond yield re-pricing remains asymmetrically high given the fiscal trajectory. The compensation for taking that risk at current yields is inadequate.
- Maintain dry powder. The cycle rarely runs in a straight line. The 1975–76 gold correction happened mid-cycle and was brutal for people who were overextended. A credit event or recessionary shock could produce a similar window in this cycle.
- Treat the second wave as a base case, not a tail risk. Position for it deliberately rather than reactively.
I’ll close with the observation that the 1970s cycle did end. Volcker fixed it at enormous economic cost, with political cover from a president willing to absorb a severe recession. The analog is not a prediction of permanent dysfunction. It’s a roadmap for what the path through this cycle may look like, and where the genuine risks sit along the way. I’d rather have this conversation now than in 2028.
P.S. Always think about what people are saying and where their incentives reside. I find it comical that AI leaders are telling us to prepare for “universal high income” and a future of abundance. Remember that Anthropic, Open AI, and SpaceX/AI are coming to the market soon for the largest IPO’s in history. Those deals need to be SOLD with some marketing in order to be successful…
Comments are closed